MENDEL Screenshots
Web user interface of Mendel's Accountant showing a portion of the input window.

Click to enlarge.
Web user interface of Mendel's Accountant showing a portion of the output window.

Click to enlarge.
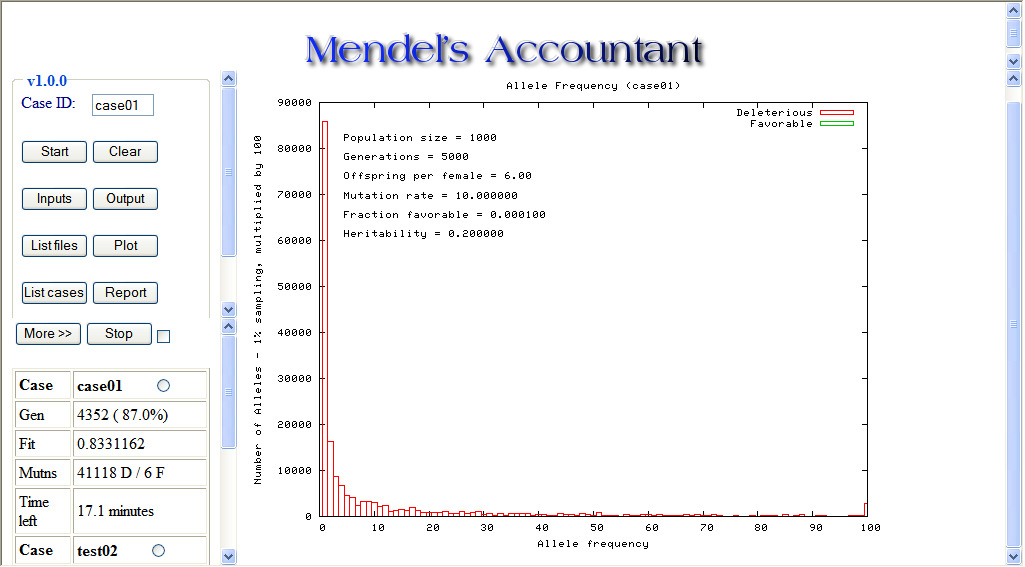
Web user interface of Mendel's Accountant showing a plot of allele frequencies.

Click to enlarge.
Web user interface of Mendel's Accountant showing distribution of mutations with respect to fitness effect.
Click to enlarge. Red bars represent mutation distribution in the absence of selection. Blue and green bars represent actual accumulated recessive and dominant mutations, respectively, in the presence of selection. The two bars representing mutation classes with effects nearest zero extend beyond the vertical scale of the plot.